A line on a map that represents a constant value of the parameter being mapped. This line includes points of equal value and separates points of higher value from points of lower value.
The contour lines and contour intervals depict elevation / altitude and depth, illustrating the general terrain for an area.
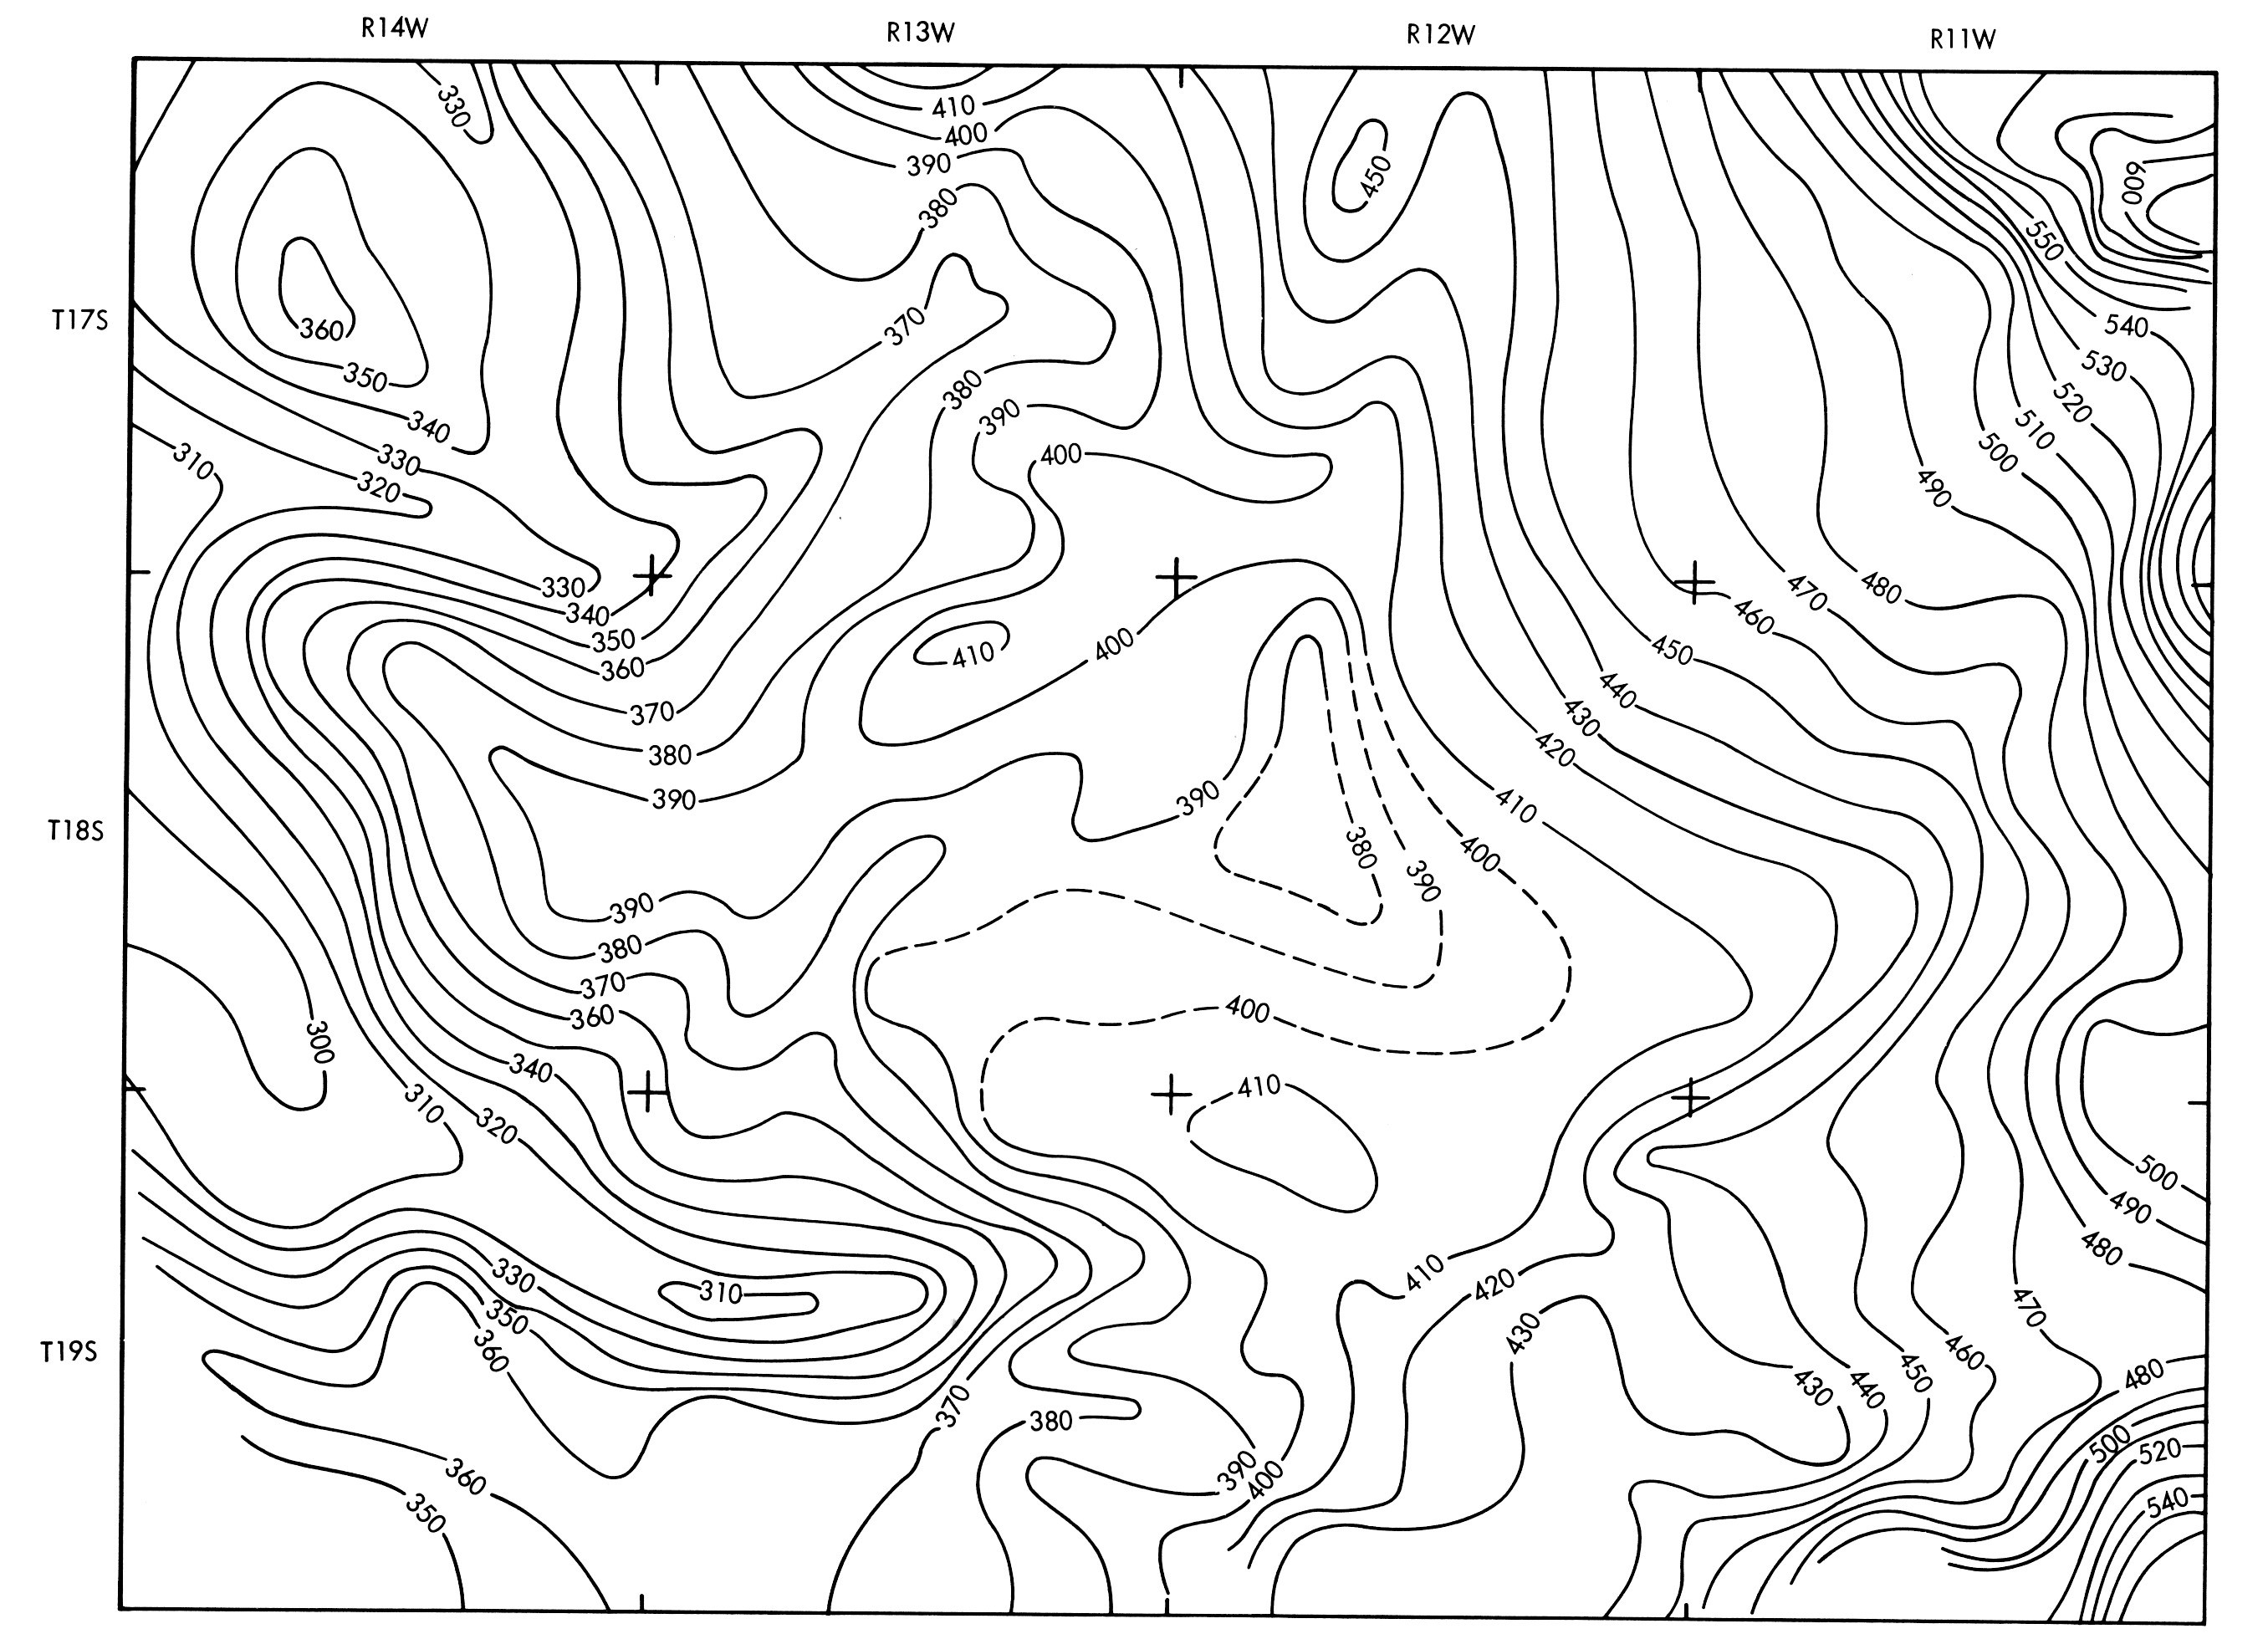
In general contours are commonly drawn on maps to represent the structural configuration of the Earth's surface or formations in the subsurface. For example, structure maps contain contours of constant elevation with respect to a datum (such as sea level). Contours are also used to interpret subsurface configurations of rock bodies in areas of limited control, such as drawing contours of the thickness of a common rock unit in several widely separated wells to extrapolate its thickness in a nearby undrilled location.
Common types of contour maps include topographic contour maps, which show the elevation of the Earth's surface; structure contour maps, which show the elevation or depth of a formation; and gross or net sand or pay maps, which show variations in the thickness of a stratigraphic unit, also called isopatchs.